Hi there kids! Ever wonder why there’s so much surf forecasting going on these days – but nobody ever tells you HOW?
Here at ASL we are nerdily keen to introduce you to the world of Do-It-Yourself forecasting, so we are gonna try an experiment.
Using a daily look at one of the world’s most reliable surface air pressure weather charts, we’re gonna take you through the whole crazy process of predicting a swell. Not only that – we’re gonna roll the dice on it ourselves! We’re using the power of prediction to set up a short yet potentially epic surf trip based on what we all see unfolding over the next week and a half.
OUR MAGIC DAY: MAY 10, 2009
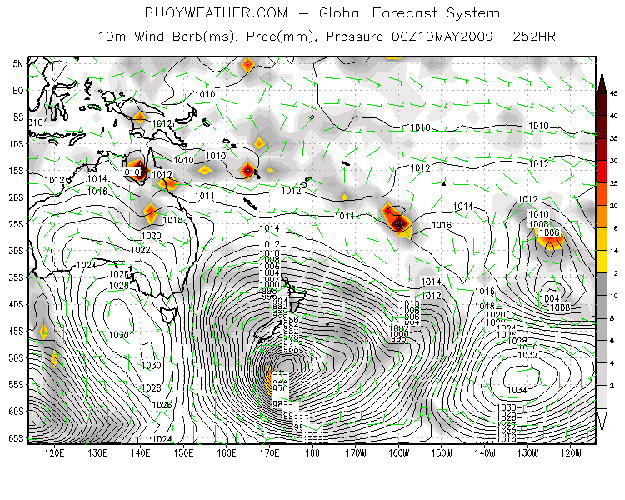
Here is a weather chart for our magic day. It’s been produced 10 days in advance by the computers at Buoyweather.com. Let’s have a close look at this little puppy and see what it suggests will be happening on the day.
The chart shows a couple of massive, incredible features:
A very deep centre of low air pressure, just south of New Zealand’s South Island
A solid area of high air pressure, with a coupla centres just south and west of Tasmania.
The cluster of lines between the highs and the low is called the “pressure gradient”, and it tracks the change in air pressure between the highs and the low. It’s also an indication of wind strength between the systems.
Here’s a quick step sideways for ya. Areas of high and low air pressure on the Earth’s surface work like gravity does on water in a river. Trying to even things out, the high tends to spill air toward the low. It’s called “wind”. But! The Earth itself gets in the way. It’s curved, and it’s spinning. As the air spills out from the high, it’s deflected sideways, and the deflection gets steeper the more air’s trying to get from one place to the other. Thus, surface winds on Planet Earth tend to follow the lines of the pressure gradient – and in our hemisphere, that means the winds circulate clockwise around low pressures and atni-clockwise around highs.
Back to the map. Now you can see what we’re kinda frothing about. If this map turns out to be right, on May 10 there’s going to be a huge, wide, long area of gale force southerly winds taking up pretty much the whole southern Tasman Sea and waters south of it. Plus, go a bit further south, and there’s an area of south-east winds blowing like buggery straight at most of Australia’s east coast.
We’re talking BIG SURF for everywhere north of Eden and south of the Goldie, and more BIG SURF for all the islands in the northern Coral Sea.
But it’s a big bloody “if”. Forecast maps 10 days ahead rarely turn out to be on the money.
Let’s watch each day as the forecast gets closer to reality. Meanwhile ask yaselves a couple of questions:
How big do you reckon the swell will be from this event?
And where the HELL should ASL’s crack team of photogs and trained seals go to score it best?
See yas tomorrow gang.


